Interactive tools
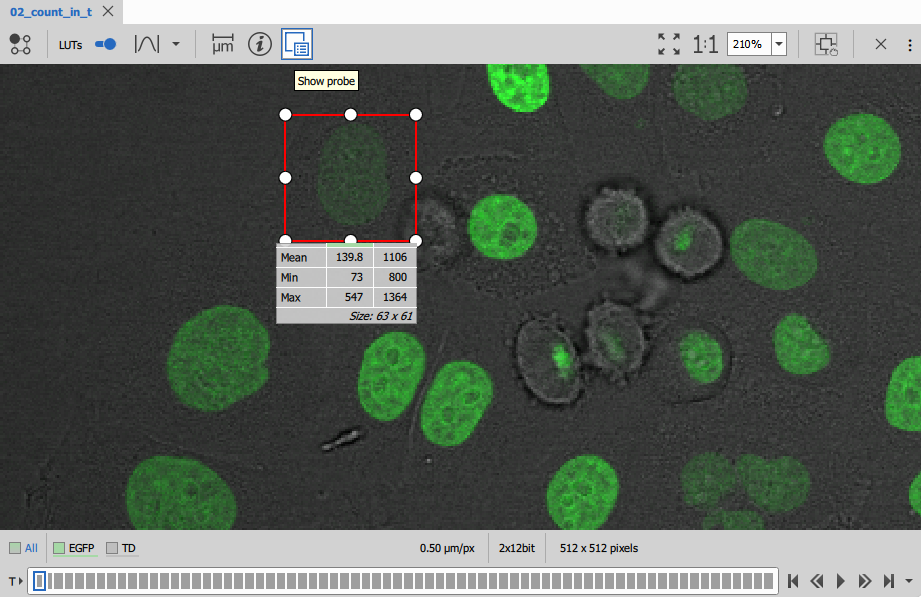
Probe
For quick inspection of intensity values, the probe shows the statistics for all channels under the rectangle.
Histogram
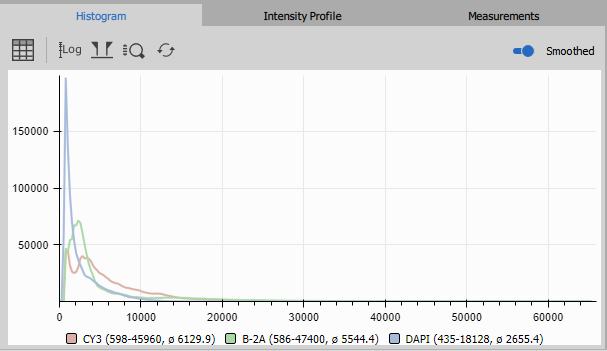
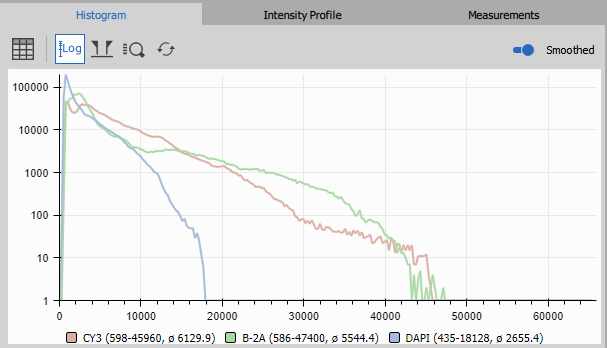
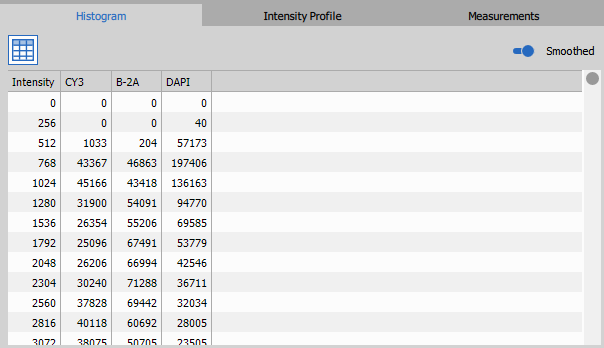
The Histogram tab shows lin, log or tabular frequencies of all intensities in the whole frame or in the probe (if probe is active).
On the horizontal x-axis, intensity is reported. On the vertical y-axis, the number of pixels is reported.
Below the graph, the range and the mean intensity of each channels is displayed.
Intensity Profile
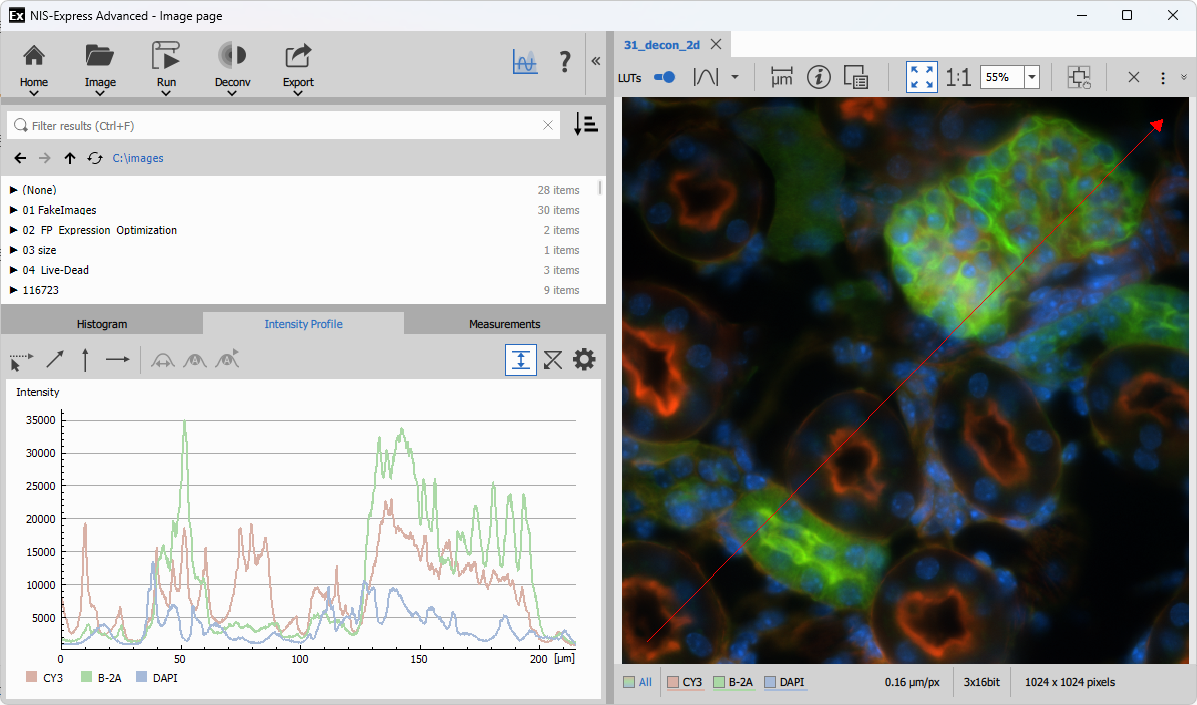
The Intensity Profile tab shows the intensity values as a graph along a line drawn on the image.
The horizontal x-axis shows the distance along the arrow and the vertical y-axis reports intensities.
Measurements
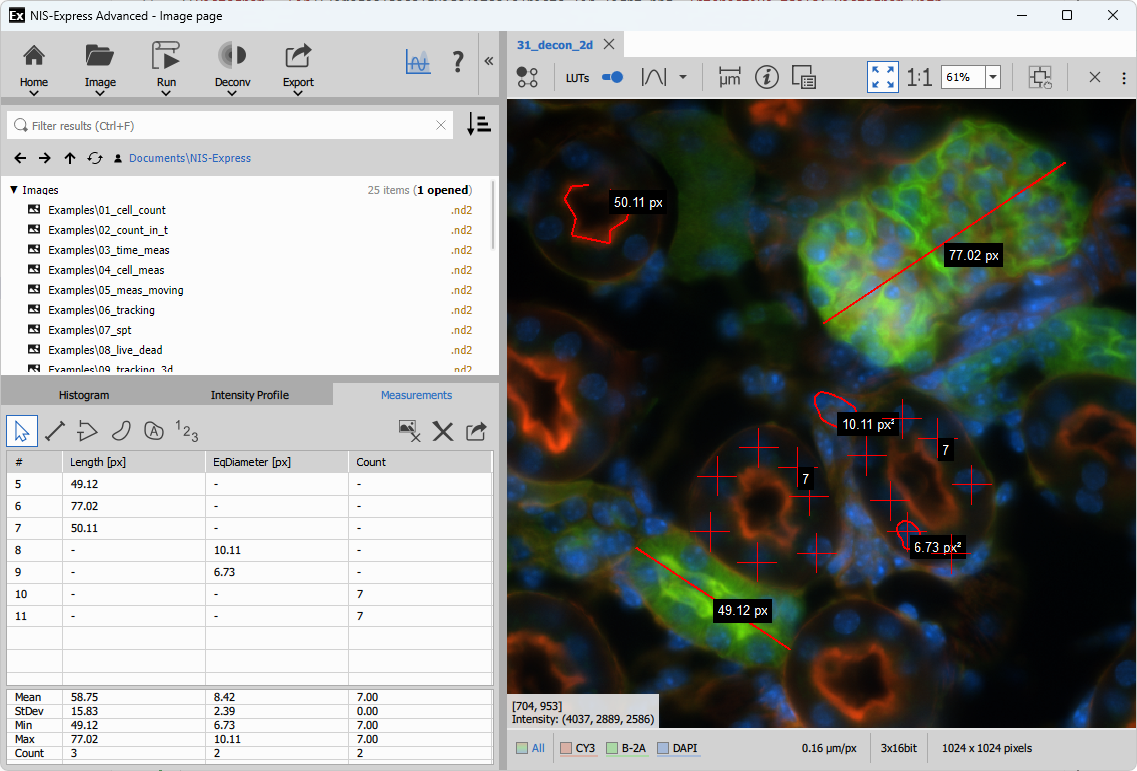
The Measurement tab allows simple measurements to be made on an opened image and export the results.
- Length
- measures the length along a path
- Line - two-point straight line
- Poly-line - composed of linear segments
- Equivalent object diameter
- measures the size of the an object
- Polygon - manually drawn
- Auto-detect Polygon - auto-detected object with postprocessing functionality
- Count
- counts objects
- Count - each click increments current counter